Nature Biotechnology / Rufus Scientific Biotech VC investment map
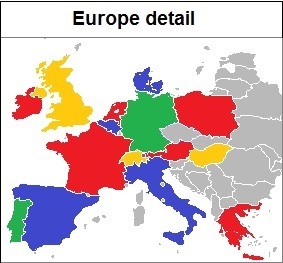
Click on any coloured part
of this map to bring up the
statistics on that region
"Investee companies"
counts the number of
companies based in that
region (or with their principal
headquarters there in the
case of companies with multiple offices).
Whole world | ||
| Investee Companies | 4754 | |
| Average investment (M$) | 11.29 | |
| Investors (any) | 1731 | |
| Investors (head office) | 1730 | |
| Rounds, by investor | |||
| Round | Number | Average size (M$) | Average age at investment (years) |
| Total | 6824 | 13.79 | 5.2 |
| Seed | 149 | 0.91 | 2.3 |
| A | 1238 | 9.61 | 3.5 |
| B | 955 | 16.13 | 5.3 |
| C | 579 | 21.43 | 6.6 |
| D+ | 419 | 23.95 | 8.3 |
| .. | All other values are based on whether the investor is based in that region or not. Investors are classified by there their head office is {Investors (head office)} or where they have any office {investors(any)}. The location of companies and investors was curated manually from web sources. Default values for a region are for all the data in the dataset. By clicking on the buttons on the top left, the dataset can be sliced into data from investments made in three time periods. |
Return to whole world statistics |
China is not included in the analysis. While there is substantial investment activity in China, it's economic system is significantly different from the free market economies of the other countries analysed, making comparison between those countries and China meaningless (c) Rufus Scientific / Nature Biotechnology 2016. All rights reserved. See the linked commentary for more analysis of this dataset.. |
Click here for details on how the statistics are calculated |
 .
.